Design Innovations
The last section introduced several "distinguishing features" of GeoGardenClub. This section provides a more detailed look at the design innovations that distinguish GGC from other home gardening technologies:
- Garden data is aggregated within local geographic regions called "Chapters".
- Access control enables collaborative garden planning and management.
- Multi-year garden timelines facilitate experience-based improvement.
- Chapter timelines facilitate discovery of local "best practices".
- Observations complement timeline data with visual data.
- Outcome data supports improvement within a single garden and across the chapter.
- Support for seed saving and seed sharing.
Garden data is aggregated within local geographic regions called "Chapters".
Each GGC garden is associated with a "Chapter", which collects together a set of gardens that share the same geographic region and (mostly) similar climate.
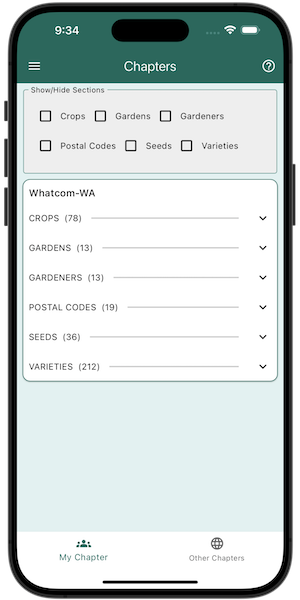
Just as important, the gardeners associated with a Chapter share the same geographic region: they are within walking (or biking) distance of each other. We implement this by defining Chapters as a set of contiguous zip codes. For example, as shown in the adjacent screen shot, the Whatcom Washington Chapter consists of 19 zip codes.
Chapters are used by GGC to organize and limit the kinds of data sharing. Garden data is only shared within a Chapter. This means that data about plants, outcomes, and timing are all local to your garden's immediate geographical region.
We anticipate that a Chapter can be "viable" with as little as a few dozen members. By viable, we mean that the collective data gathered and shared among Chapter members is sufficient to improve decision-making and garden improvement, and that communication among Chapter members succeeds in creating a local "community of practice".
On the other hand, we anticipate that if a Chapter grows beyond a few hundred members, then it might be advantageous to subdivide it into two smaller Chapters.
Access control enables collaborative garden planning and management.
Similar to other cloud-based document management systems, GGC enables collaborative access and management of garden data.
If you create a garden, you are assigned the "owner" role, which means you have total control over the garden, including the ability to delete it.
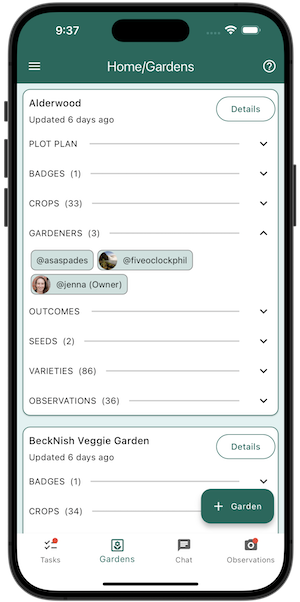
The owner of a garden can invite one or more other gardeners in the Chapter to be an "editor" of that garden. This enables co-management of a single garden by multiple gardeners. Editors have almost all the capabilities of the owner, except the ability to add/delete editors or delete the garden. The screenshot shows a garden owned by "@jenna" who has granted editing privileges to "@asaspades" and "@fiveoclockphil".
All gardeners have a read-only "view" role of all gardens in the Chapter. This means that you can view everyone's garden plans and outcome data. This enables gardeners to see what other gardeners have grown successfully in their gardens and "copy" a planting from another garden plan into their own.
While garden plans are required to be public within a Chapter, gardener identities and garden locations are not. When you register with GeoGardenClub, you create a "username" which is used to identify you. In addition, the system does not ask for the location of the garden beyond the zip code in which it is located.
Multi-year garden timelines facilitate experience-based improvement.
GGC is designed to support gardeners who want to improve their gardens by comparing and contrasting their efforts over multiple years.
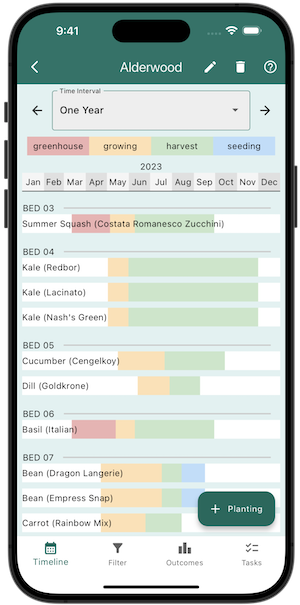
As illustrated in the adjacent screenshot, one helpful way to represent a garden is via a timeline, which specifies the contents of the garden for each year as well as important dates during the lifecycle of a planting (such as start date, transplant date, first harvest, end harvest and pull date). These dates are used to visualize the growth of a planting as one or more of four lifecycle phases: in the greenhouse, growing in the garden, harvesting produce, and finally growing of seeds.
Timeline data can be filtered to provide many insights, particularly when multiple years of garden data are available. For example, it is useful to rotate the crops planted in a bed each year in order to mitigate certain pests, diseases, and soil nutrient imbalances. A "Bed" filter view makes it easy to review what plants have been in a particular bed over time. Other filter options are: Crop, Variety, and Family.
Observations complement timeline data with visual data.
Timeline data provides important information about a planting, but does tell the whole story. What did the plant look like at various points? Did it have a problem with pests at any point? Are there additional milestones during development that the gardener wants to keep track of (such as the appearance of the first bud)?
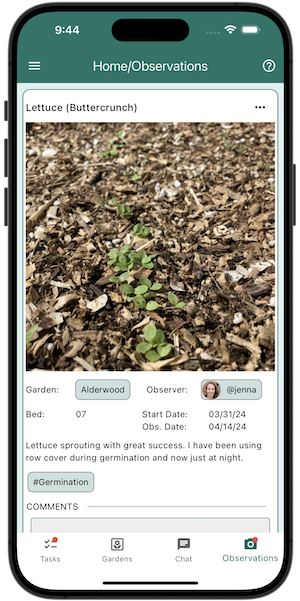
To complement the timeline, GGC allows gardeners to make "observations" regarding a single planting on a specific day. The adjacent image shows one such observation.
Observations can include phenomena such as successful germination, first flower, first harvest, diseases, or pests.
Observations can be public or private. If public, they create a mechanism for communication among chapter members, as public observations can be commented upon by any other gardener in the chapter. For example, a gardener might post an observation of a planting with an unknown pest on it and ask if other gardeners know what that pest is.
Outcome data supports improvement within a single garden and across the chapter.
An important mechanism for improvement is assessment of outcomes: How well did a single planting do? And what insights can be gained from aggregating outcome data from multiple plantings during a single season, or multiple plantings over multiple seasons, or multiple plantings across the entire chapter?
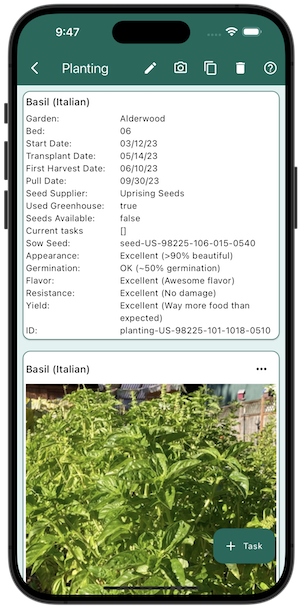
Outcome data is always created with respect to a single planting. For example, this image shows a summary of a single planting of Italian Basil during 2023, including the outcome data that the gardener assigned to it.
Up to five outcome types can be associated with a planting: Appearance, Flavor, Germination, Resistance (to pests and/or disease), and Yield.
Every outcome type is assigned a value based on a five point scale: 1 is the worst, and 5 is the best. In this case, Germination was assigned a 3 while the other outcome categories were assigned the value of 5. If the gardener had chosen to not assign a value to one or more of the outcome types, then no outcome data will be listed.
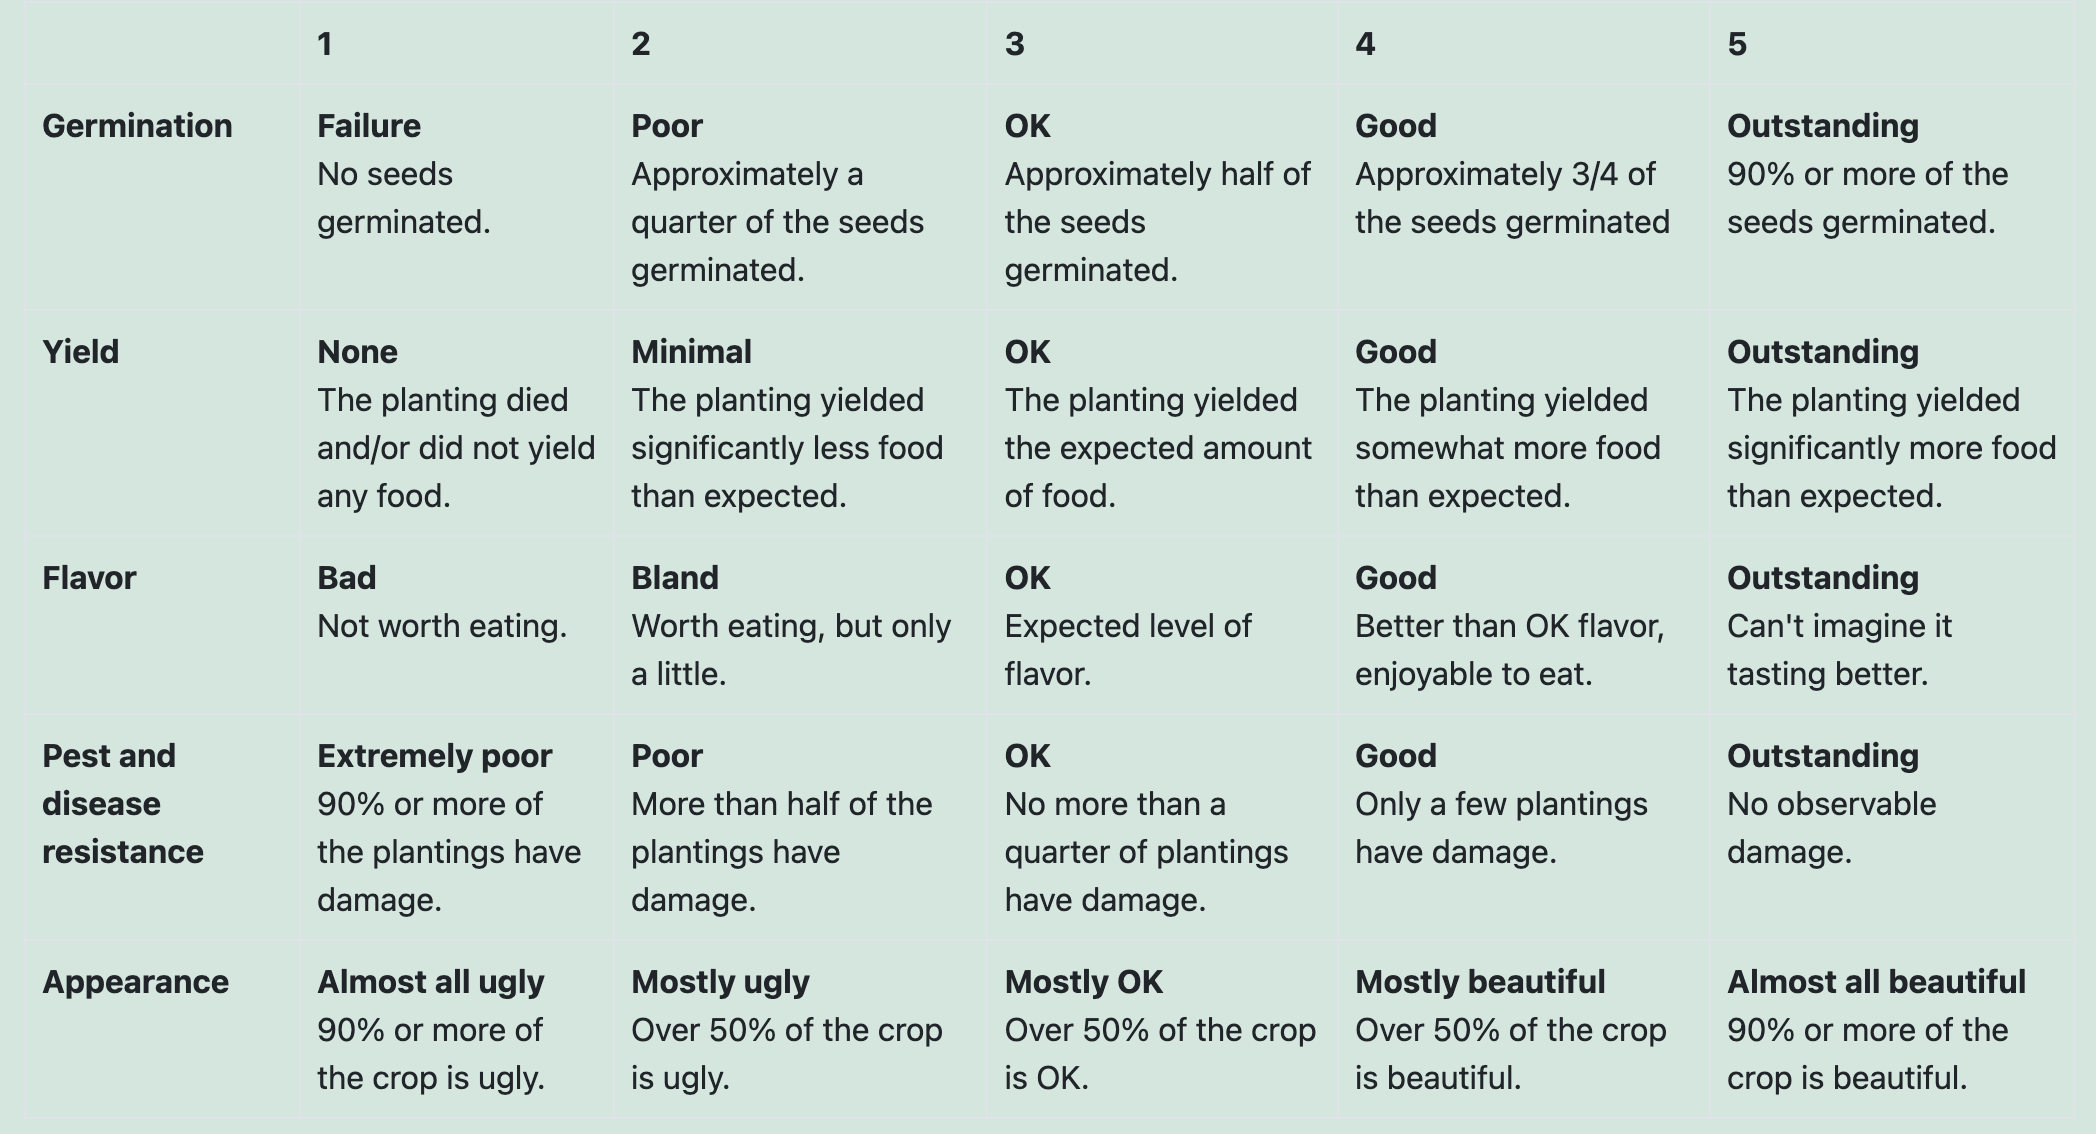
In order to combine outcome data together and produce meaningful results, it's crucial to define criteria for each numeric rating for each outcome type so that gardeners assign outcomes in a consistent manner. The following table provides the GGC criteria for assigning 1, 2, 3, 4, or 5 for each of the five outcome types.
Once outcome data exists for a set of plantings, then they can be combined to show the spectrum of outcomes associated with a plant variety (or crop) for the current garden or across all gardens in a chapter.
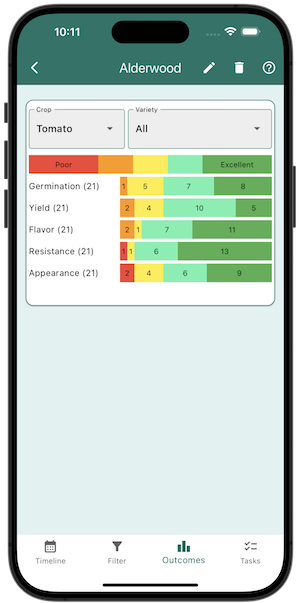
GGC provides a visualization of the spectrum of outcome data as a horizontal stacked bar chart, where dark red is 1, orange is 2, yellow is 3, light green is 4, and dark green is 5.
The adjacent screenshot provides an example for all the tomato plant varieties. So, bad tomato outcomes are unlikely but have still occurred for Appearance and Resistance, and to a lesser extent Yield, Flavor, and Germination. Tomatoes show uniformly good Resistance, and pretty good Germination.
Support for seed saving and sharing
We believe that an important step toward food resiliency is to develop local networks for seed production and sharing.
To that end, GGC enables gardeners to indicate whether they are saving seeds from a particular planting, and if so, whether they have enough seeds that they are willing to share them with the local chapter.
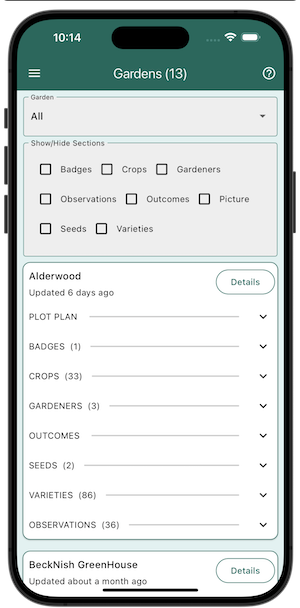
The garden summary card at left indicates that this gardener has saved seeds from Dragon Langerie beans and Pokey Joe cilantro, and they have enough seeds to share some with other Chapter members.
Seed saving and sharing has another implication: when growing a plant for seeds, you will sometimes need to leave it in the garden after there is nothing more to harvest. So, in GGC, there is the ability to indicate and "End Harvest" date as well as an "End" (i.e. Pull) date.
We can see this in the timeline view for these bean plantings:
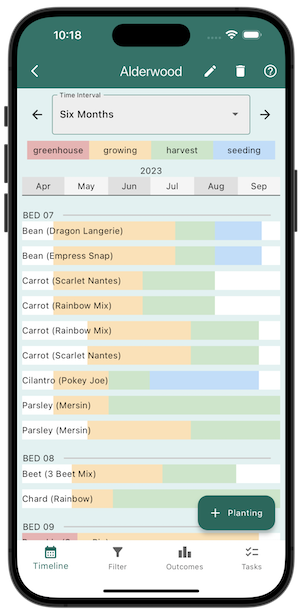
The timeline bar is green from mid-July to mid-August, indicating that this gardener was actively harvesting beans for that entire period. But from mid-August to miud-September, the timeline bar switches to blue, indicating that there is no longer any harvest but the plant is still growing (in this case, to produce seed). Reference to the planting card reveals that the harvest ended on 8/15/23 and the beans was pulled on 9/17/23.
Another example of seed saving is the cilantro planting. The gardener harvested cilantro from mid-May to mid-July, then let the plant go to seed. The plant was pulled on 8/15/23.
GGC can thus provide a new insight to gardeners: how long does it take not just to grow a seed to first harvest (which is typically provided on the seed packet) but also how long that plant yields harvest and, significantly, how long is required to yield seeds?
Chapter timelines facilitate fine tuning of plans.
Below represents a mockup of the Chapter Timelines feature. This feature is still in development and is not yet available in the application.
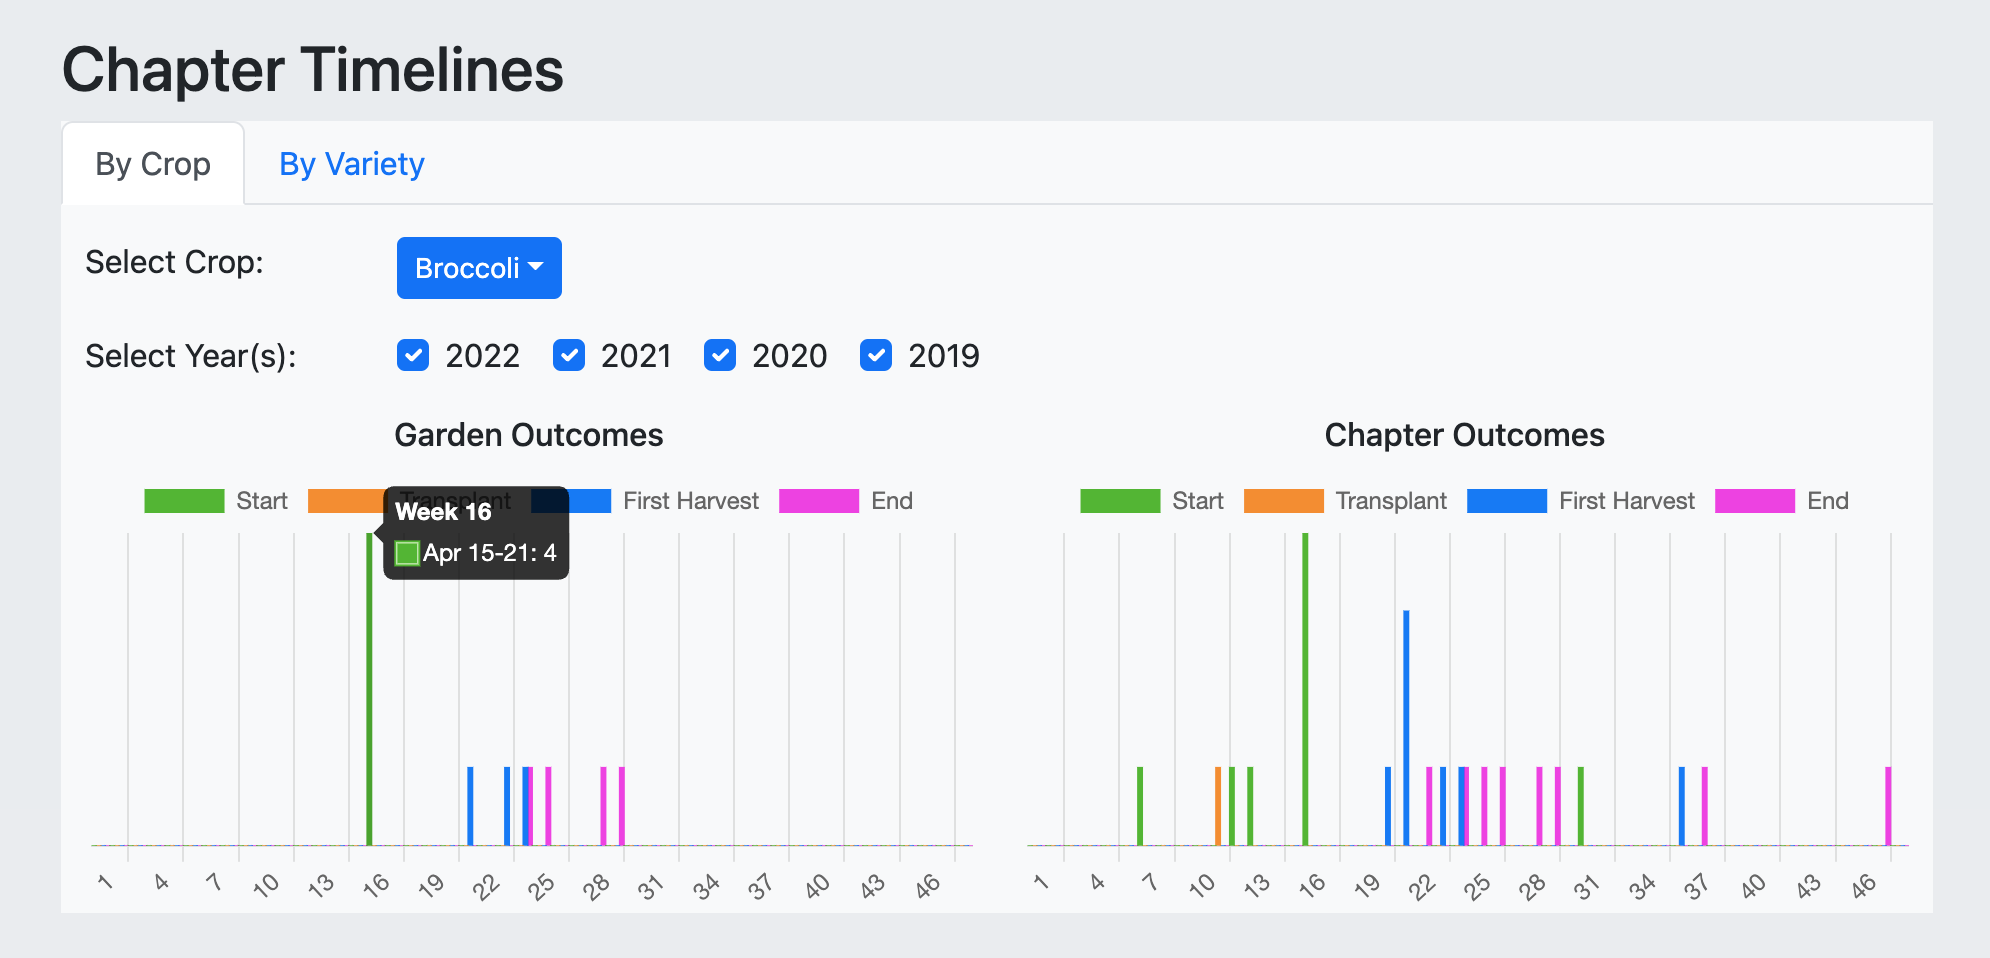
One way to improve garden productivity is by learning best practices in your local geographic region for the timing of planting. GGC Chapter Timelines provide a simple way to view timing data for your own garden, then compare it to timing data across the entire chapter.
While this feature is still in development, we can see in the example image above that this gardener has planted broccoli only during Week 16 (i.e. between April 15-21) and the latest they left their broccoli was Week 29 (July 22-30). The Chapter Timeline shows that there are gardeners in the Chapter who have planted broccoli as early as Week 7 and left the broccoli in the ground until the end of the year.
This chart by itself is not enough information for the gardener to decide what to do, but it is enough information to start a conversation within the Chapter about the timing of broccoli if the gardener wants to change their practices.